ChemRICH Class

This tool allow performing enrichment analysis for user provided class annotation. It uses KS-test to calculate the set-level p-values and uses chemical similarity clustering to order compounds in the ChemRICH impact plot.

Input file structure

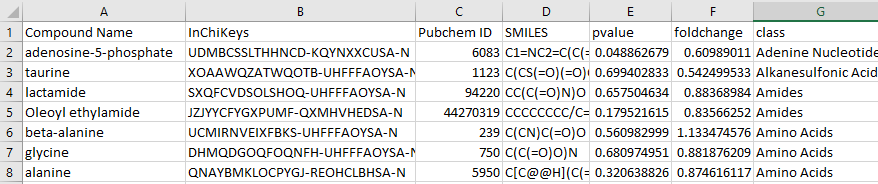
Structure of the input file. See here an example data file you can use as template.

The input file must have 7 columns, in this order:

  • Column 1 = Compound Name
  • Column 2 = InChiKeys
  • Column 3= Pubchem ID
  • Column 4 = SMILES
  • Column 5 = pvalue
  • Column 6= foldchange
  • Column 7= Class
You can obtain PubChem CIDs and InChI keys from the Chemical Translation Service. You can obtain SMILES from the PubChem Identifier Exchanger tool.

Calculate ChemRICH

ChemRICH results

  • This plot shows the ChemRICH enrichment result.
  • It shows the significantly impacted metabolite clusters in your study.
  • Clusters are generated by chemical similarity and ontology mapping.
  • The plot y-axis shows the most significantly altered clusters on the top.
  • Cluster colors give the proportion of increased or decreased compounds (red = increased, blue = decreased). Chemical enrichment statistics is calculated by Kolmogorov–Smirnov test.
  • Only enrichment clusters are shown that are significantly different at p<0.05.

Download results in various format.

  • ChemRICH tree plot (.pptx)
  • ChemRICH cluster plot (.png)
  • ChemRICH results (.xlsx)
  • Access the Interactive Compound plot

Cluster level enrichment results

Compound level data.table

Contact, bug reports and source code.

Dinesh Barupal - dinkumar@ucdavis.edu & Oliver Fiehn - ofiehn@ucdavis.edu

Github repo - barupal/chemrich

Citation.

Barupal Dinesh K & Fiehn Oliver. ChemRICH : Chemical Similarity Enrichment Analysis for metabolomics datasets. Scientific Reports (2017).