Why use ChemRICH ?
Metabolomics aims to answer a fundamental question in biology: How does metabolism change under genetic, environmental or phenotypic perturbations? Combining several metabolomics assays can yield datasets for more than 1,000 structurally identified metabolites per study. However, biological interpretations of metabolic regulation in these datasets is hindered by the limitations of current pathway definitions as well as inherent limits of pathway enrichment statistics. ChemRICH, a statistical enrichment approach that is based on chemical similarity rather than sparse biochemical knowledge annotations. ChemRICH utilizes chemical ontologies abd structrual similarity to group metabolites. Unlike pathway mapping, this strategy yields study-specific, non-overlapping sets of all identified metabolites. Subsequent enrichment statistics is superior to pathway enrichments because ChemRICH sets have a self-contained size where p-values do not rely on the size of a background database. For more details - see ChemRICH article
Input file structure
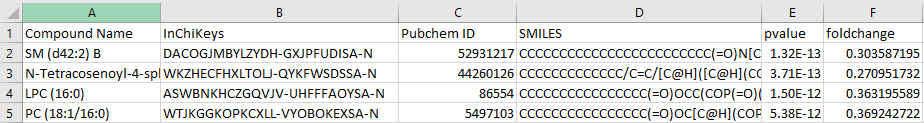
Structure of the input file. See here an example data file you can use as template.
The input file must have 6 columns, in this order:
- Column 1 = Compound Name
- Column 2 = InChiKeys
- Column 3= Pubchem ID
- Column 4 = SMILES
- Column 5 = pvalue
- Column 6= foldchange
You can also use this excel file for getting identifiers and SMILES codes for your compounds. ChemRICH Metabolite Identifier File .
Input file must satisfy these conditions
- No duplicate names OR CIDs
- No Missing names, SMILES, pvalue or fold-change
- Minimum one class with at least three compounds
- Minimum one class shall be significantly enriched